Share post via this link: permalink.
Why does it matter if developers exaggerate affordability? Because sprawl developers have convinced decision-makers that we should completely disregard the publicly developed, consensus-based road map to growth, based on a claim that their projects provide the much needed workforce housing that the county needs. Unfortunately, these claims are suspect and the housing they are proposing is not affordable to workforce households or even those making less than 6 figures which is the majority of households in San Diego County. Grow the San Diego Way deconstructs how they make these claims and create a more accurate pricing model using Newland Sierra and other projects as a case study.
The County general plan focuses on building in higher density villages; saves taxpayer hundreds of millions in infrastructure dollars, protects habitat and encourages affordability
As a refresher, the County general plan was developed with public input over 13 years and at the cost of $18 million. More than 500 public meetings and workshops were held involving 29 different communities, a building industry working group, environmental groups and other stakeholders. They arrived at a “smart growth” compromise that ensured that the unincorporated area would allow for needed housing growth while saving billions on infrastructure costs, limiting development in high fire risk areas and limiting habitat destruction and pollution among other benefits.

The general plan mapped out and zoned for 66,000 additional housing units that could be built by developers, “by right,” meaning without needing discretionary approval from the Board of Supervisors. The majority of these units are located in higher density village areas (allowing for more affordable multifamily and smaller, single family units) rather than in the lower density rural or semi-rural areas, for the reasons mentioned above.

Of course, like all compromises, not everyone got exactly what they wanted: the building industry wanted more access to rural lands and environmental groups felt it didn’t go far enough in stopping development in biologically sensitive areas.
Rules are meant to be broken, right?
Despite this carefully-crafted plan, a number of “sprawl” developers chose to completely disregard the plan altogether and have proposed a near-constant stream of projects that require special exemptions to the general plan via a vote of the Board of Supervisors. These exemptions, known as General Plan Amendments (GPAs) generally violate all the principles of this smart-growth general plan. There are at least 17 in the pipeline with upwards of 15,000 units in very high fire severity zones and requiring hundreds of miles of new roads (rather than leveraging existing infrastructure as the general plan requires). The vast majority of these projects are single-family-home market rate projects with NO affordability at all, according to the county’s reports issued on each project.
Why are they not building projects within the general plan, in villages and away from very-high fire severity zones?
Well, first of all, there are some developers who have successfully built projects within the general plan parameters. They have been rewarded by community support, little pushback and no litigation from environmental groups. This includes projects like Park Circle1and Harmony Grove Village2 which are currently being built (over 1,200 units). However, the many GPA projects that are in the pipeline are being proposed precisely because supervisors have shown they will approve these projects and are, effectively, incentivizing developers to disregard the general plan entirely. And, furthermore the county’s planning staff has been directed to do everything possible to help these projects get approved, including using loopholes to approve more than the four GPAs per year that state law allows3. One can argue that an amendment to the general plan may occasionally be necessary from time to time as an exception to the rule, but in the case of the county, the exception has become the rule that has effectively rendered the general plan irrelevant. And, importantly, these projects are anathema to good planning, sustainability and the smart directing of our region’s growth in more efficient and compact development patterns. In other words, it is exactly the kind of sprawl that the general plan was intended to avoid.
GPA projects are nowhere near close to being workforce housing
It is important to note that GPA projects are not workforce housing as some developers are claiming. GPA projects are higher-end market rate residential subdivisions that are bound by the natural laws of the market. Sprawl developers use words such as “attainable” and “workforce housing” to avoid the reality that they are bereft of any affordable housing. Granted, it is nearly impossible for for-profit developers to create naturally affordable housing, but they seem to be focusing on higher end products regardless. This segment of the market (higher end homes in the “above moderate income” segment) is actually saturated, which is one reason construction has slowed recently and why these homes sit on the market longer than more affordable products. It is the one segment where the region is approaching or exceeding its state-mandated goals while production of “moderate” (or lower) income housing is extremely anemic. Moderate income households, occasionally referred to as workforce households, make between 80% to 120% of the area median income (AMI) which is between $69,000 to $103,000 annually and the industry is simply not delivering it.

Even developers who have approved projects seem to have slowed production as the number of luxury buyers who can afford high end homes is starting to become tapped out. One need only look at Harmony Grove Village, which was approved and entitled for 742 units 11 years ago, but has only built 300 or so units. And there are numerous entitled projects in the County that are not being built for whatever reason. Currently, the countywide average for a newly-built single family home is $710,0004, which would require an annual household income of approximately $200,000 (230% of the area median income).
Calculating who can afford a house is fairly straightforward.
The equation for calculating a mortgage payment is all that is needed to determine your monthly payment and thus, how much a person can afford. The interest rate and the length of the term (30 years) determines how much of each payment will be principal and interest. The payment also includes property taxes, homeowner’s insurance, private mortgage insurance and any HOA fees. Using federal, state or local standards, a household’s monthly payment cannot be more than 30% of the monthly pre-tax income (including utilities, though this is often ignored in calculations). We’ve created an online, interactive calculator (embedded in this post below and also on our website) which allows you to play around with the various variables to see how they impact the payment and thus how much income is required to afford that payment.
Newland Sierra: a case study on how the industry exaggerates affordability in the project proposal phase.
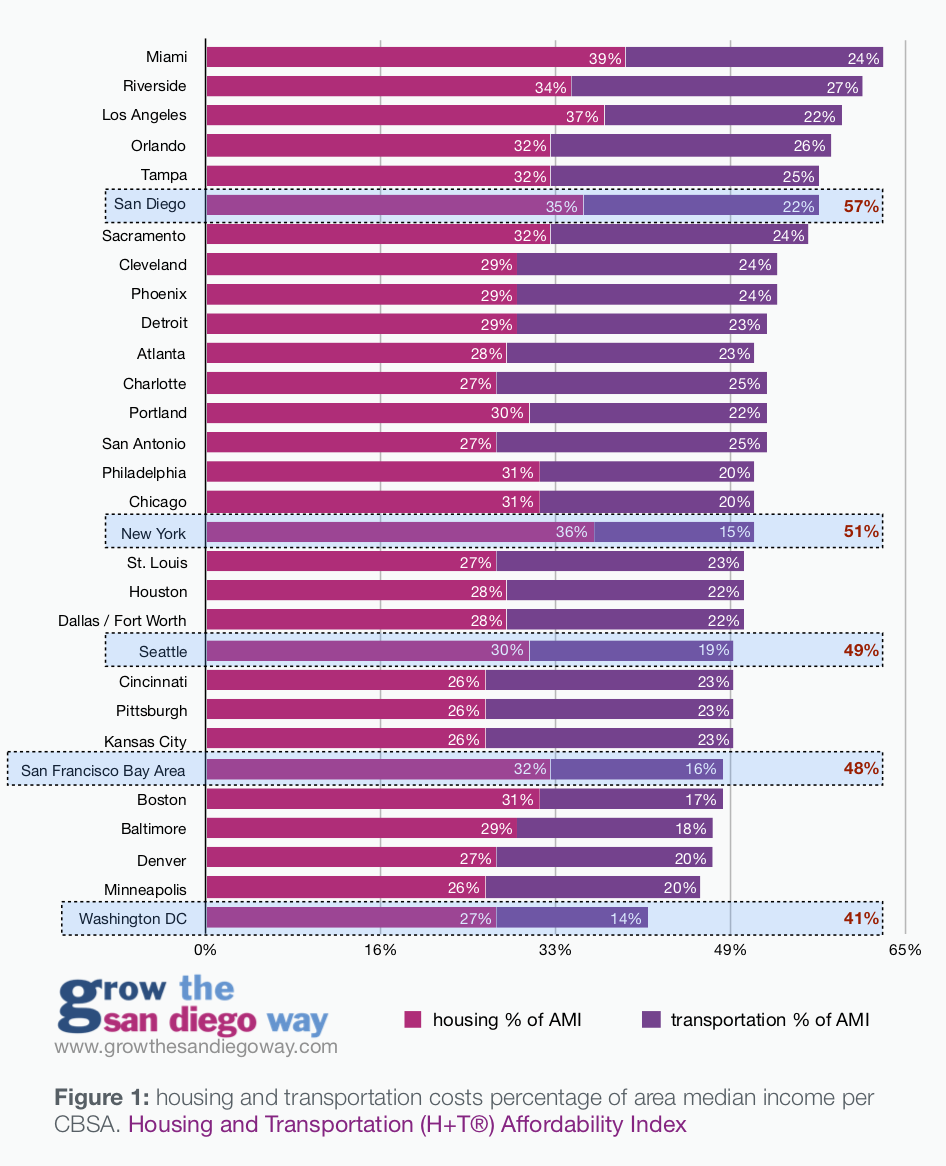
An in-depth review of Newland Sierra’s market analysis5 (a publicly available report included as an appendix in the county’s Environmental Impact Review) reveals some major fudging of the numbers to inflate the affordability of the project. And, currently, as they face a public referendum6 on the project’s approval (in addition to numerous lawsuits), they claimed that 80% of their project is “attainable to working families.” Our calculations show the only families who will be able to afford these homes will be upper income households. Grow the San Diego Way presented an initial analysis to the Board of Supervisors and has refined and updated it subsequently.

Here’s what we found:
- The consultants who put together the market analysis 7 used 35% as the affordability factor instead of the universal standard of 30%.

- California’s Department of Housing and Community Development (HCD), the federal Housing and Urban Development (HUD) and all local housing authorities (including the County) all use 30% of household income as the threshold for whether or not a household is burdened8.

- They used 10% downpayment to calculate whether someone can afford their homes (pages 9-10). County planning staff uses 5% (and, nationwide, the average downpayment for first-time buyers9 is around 5%). Moderate and low income homebuyers do not typically have 10% downpayments. They’re lucky if they have 5%.
- They also do not appear to make any reference to taxes and insurance in the payment calculations (required by County, state and feds) nor do they make any reference to PMI (private mortgage insurance) which is also required on down-payments under 20%. Mortgage lending standards include these in their calculations when determining what a buyer can afford. This report claims somehow, that a household making $62,832 can afford a $426,000 home.

The only way to come close to that number is to calculate payments based on principal and interest alone and ignoring property taxes, insurance or private mortgage insurance (PMI, required for purchases with a downpayment lower than 20%). Mortgage lenders and the federal, state and local governments require these in their affordability models. According to standard pricing models (and crosschecked with Zillow Mortgage Affordability Calculator) a household with a $62,832 income would only be able to afford roughly a $260,000 home. So, something is very wrong with this number and it appears to be based on a standard principal and interest calculation without, taxes, insurance or PMI. Even so, it is understated.

- In addition, they are using outdated 2016 market values to determine their pricing matrix. They took the opportunity to revise their report in 2018 (for the final report to the County) but did not change the prices in their product matrix chart with the caveat “prices are stated as base prices in today’s dollars and are subject to change based on future economic and market conditions.” Market rates have increased about 16% since August 2016 so the numbers they are touting are significantly lower than they should be. We’ve applied that factor to their matrix to derive a more accurate value.

- Their pricing tables (page 9) also appear to have some serious errors such as showing widely different incomes needed to afford the various units. For example: a $750,000 house shows $66,000 income needed to purchase but a lower priced $732,000 house shows a higher income needed, $72,000. Both are absurdly low, but even so, they contradict each other.

- They do not include HOA or Mello Roos, which lowers affordability by increasing the income required by around $4000 for every $100 added to the housing payment. A mortgage lender factors in these fees as part of their lending standards. HOA fees average around $327 in San Diego County.10 Mello Roos11 (Community Facilities Districts payments for infrastructure) could be anywhere from $150 to $400 a month (there isn’t reliable data unfortunately). So the income required increases by at least $12,000 and probably closer to $24,000.
The result? Grossly understated prices, overstated affordability
Taking into account these erroneous assumptions and applying updating market values for September 2019 prices, the project averages $636,548 per unit for the 2,135 units. This would require a household income of $177,644 (or more than double the area median income for a family of 4). And even the smallest, lowest priced units (less than 6% of units, around 1,100 square feet) would be about $410,000. For reference, these are affordable to households making about $114,000 per year (130% of AMI, or considered “above moderate”). And this doesn’t include HOA or Mello Roos which would increase the income required (per lending standards) by $12,000 if we assume conservatively that HOA and Mello Roos fees will add up to $300 per month.
Ironically, when the products come to market, the developer will likely not be inflating the market value as they seek to maximize the sales and profit on the project (as they should). It is disingenuous that they downplay the costs in this phase in order to gain approval.
Based on our analysis, there are no units affordable to moderate income (or lower) households. No workforce housing. No affordability. And no inclusionary housing. Just 2,135 units of market rate housing in a fire-prone part of the county that was previously designated for 99 units.
The County staff report for Newland Sierra itself states that there is ZERO affordable housing.

Their PR people are saying in the media that they “promise” to include some, but there is no guarantee of that. It is just rhetoric meant to win over supporters. The Final EIR, approved by the BOS, states unequivocally that the project does not have any affordable components. This document is legally binding, whereas public pronouncements are not. It is the officially-approved project that voters will be voting on, not the promises made after the fact.


Not just Newland
And for additional evidence, we see similar manipulation in affordability calculations on other GPA projects that attempt to make this claim (Otay Village 14, for example). We haven’t delved deeply into their market analysis, but a topline view uncovers some erroneous assumptions, the most obvious one is they use an inaccurate Area Media Income (AMI) assumption. They use $107,000 as the figure which is about $20,000 too high.

The state and federal charts show a much lower number of $86,300 for a family of four in 2019:

None of the projects have any inclusionary housing and virtually none of them, according to the County, meet the “affordability” density of 10.9 units per acre. Since most of the projects lack a market analysis like Newland Sierra did, we had to conduct additional analysis on a smaller subset of recently-approved GPAs: Valiano (Integral Communities) and Harmony Grove Village South (Kovach Partners, Real Capital Solutions), both located in the Harmony Grove area of the unincorporated county. They are immediately adjacent to the project mentioned above, currently under construction by Lennar, Harmony Grove Village (not south). Both projects’ EIRs provide a list of lots, products and estimated square footage which allows us to create a model based on similar products nearby. The comps from the existing project make for a good proxy to determine the cost of the proposed projects based on the comps and product mix.
Valiano, based on square footage and comps from HGV, will average in the high $700,000 range. HGV South will average in the mid $600,000 to $700,000 range. For reference, this is in line with the countywide average for a newly built single family home: $710K, so no surprise here.
The narrative and who drives the discussion
When the folks who set the narrative are those who profit from that narrative, you have to take it with a grain of salt or at least look for other more objective sources. At the moment, those driving the housing and pro-sprawl narrative are painting a picture that is one-sided and misleading at best. Developers seeking a general plan amendment project in fire country are going to have to come up with a better justification than affordability, because it’s just not there.
Online Affordability Calculator
If you’re interested in looking at housing affordability further, we’ve developed an online affordability calculator which allows anyone to enter in a home value and it spits out the income required to purchase that home using the various assumptions that can be tweaked. And it also tells you whether the unit is affordable to Very Low, Low, Moderate or Above Moderate income households in the San Diego region. It is embedded below but is available with further explanation at: http://www.growthesandiegoway.com/affordability/
JOIN OUR MAILING LIST TO BE KEPT UP TO DATE ON THE LATEST IN SAN DIEGO LAND USE AND HOUSING ANALYSIS
Links and documents
- “Unlike other large housing projects proposed for unincorporated parts of the county, Park Circle was approved last year without significant controversy because the property was zoned for development and an amendment to the county’s General Plan was not needed.” J. Harry Jones, June 27, 2019, San Diego Union-Tribune, A master-planned, 632-home project breaks ground in Valley Center
- “The supervisors hailed Harmony Grove Village’s design process as a model of cooperation between a developer and a community. “We’ve never had an audience so overwhelmingly in favor of aproject,” said Supervisor Bill Horn. More than 20 people addressed the board, mostly supporting New Urban West.”Quinn Eastman, February 8, 2007, San Diego Union-Tribune, Supervisors OK Harmony Grove Village
- April 30, 2018, Grow the San Diego Way, County of San Diego Contemplates Bundling GPA Projects to Sidestep State Law http://www.growthesandiegoway.com/bundling-gpas.html
- “Newly built homes: Median price of $710,000, down from all-time high of $812,500 in October 2018. There were 329 sales, seven fewer than August 2018.” Sept. 15, 2019, Phillip Molnar, San Diego Union-Tribune, San Diego home price down annually for first time in 7 years
- MarketPointe Realty Advisors, Newland Sierra Market Analysis, April 2018
- Alexander Nguyen, December 11, 2018, Times of San Diego, Voters to Decide Fate of Controversial Newland Sierra Development
- MarketPointe Realty Advisors, Newland Sierra Market Analysis, April 2018, Page 3
- Department of Housing and Community Development, Income Limits 2019
- National Association of Realtors, 2018 Profile of Home Buyers and Sellers
- “A new study by Trulia says the average condo fee in San Diego is now $327 a month. That’s up 43 percent in the last ten years. In that same time period, wages in San Diego only rose 33 percent, so the increased fees are taking up a larger chunk of paychecks.” March 15, 2017, Jonathan Horn, Channel 10, Report: HOA fees skyrocketing in San Diego
- “Under Proposition 13, property tax increases are restricted and new local taxes are subject to a two-thirds vote of the people. But Mello-Roos landowners, usually developers, do an end-run around the public vote and partner with school districts or cities to form Community Facilities Districts (CFD) that can levy taxes. This usually happens with only the developer’s approval because in most cases, the land in the CFD is not developed and there are no registered voters. Once the homeowners move into the newly developed neighborhoods, they are subject to the new tax for decades.” May 21, 2013, Kevin Crowe, KPBS, Do You Pay Extra Property Taxes? Mello-Roos: Who’s Paying What (Video)